
Business and marketing reporting for e-commerce
Read the numbers. Stop rebuilding the report.
Bring the agreed sales, advertising and cost data into a dashboard your team can use. Vulc builds the connections, definitions and views around the decisions you need to make.
You should not need a reporting project before every decision.
Export the sales. Pull the ad spend. Find the costs. Check the dates. Work out why two platforms disagree.
A useful reporting system reduces that repeated assembly and makes the definitions visible—so your team knows what a number represents and what is still missing.
The business view and the marketing detail belong together.
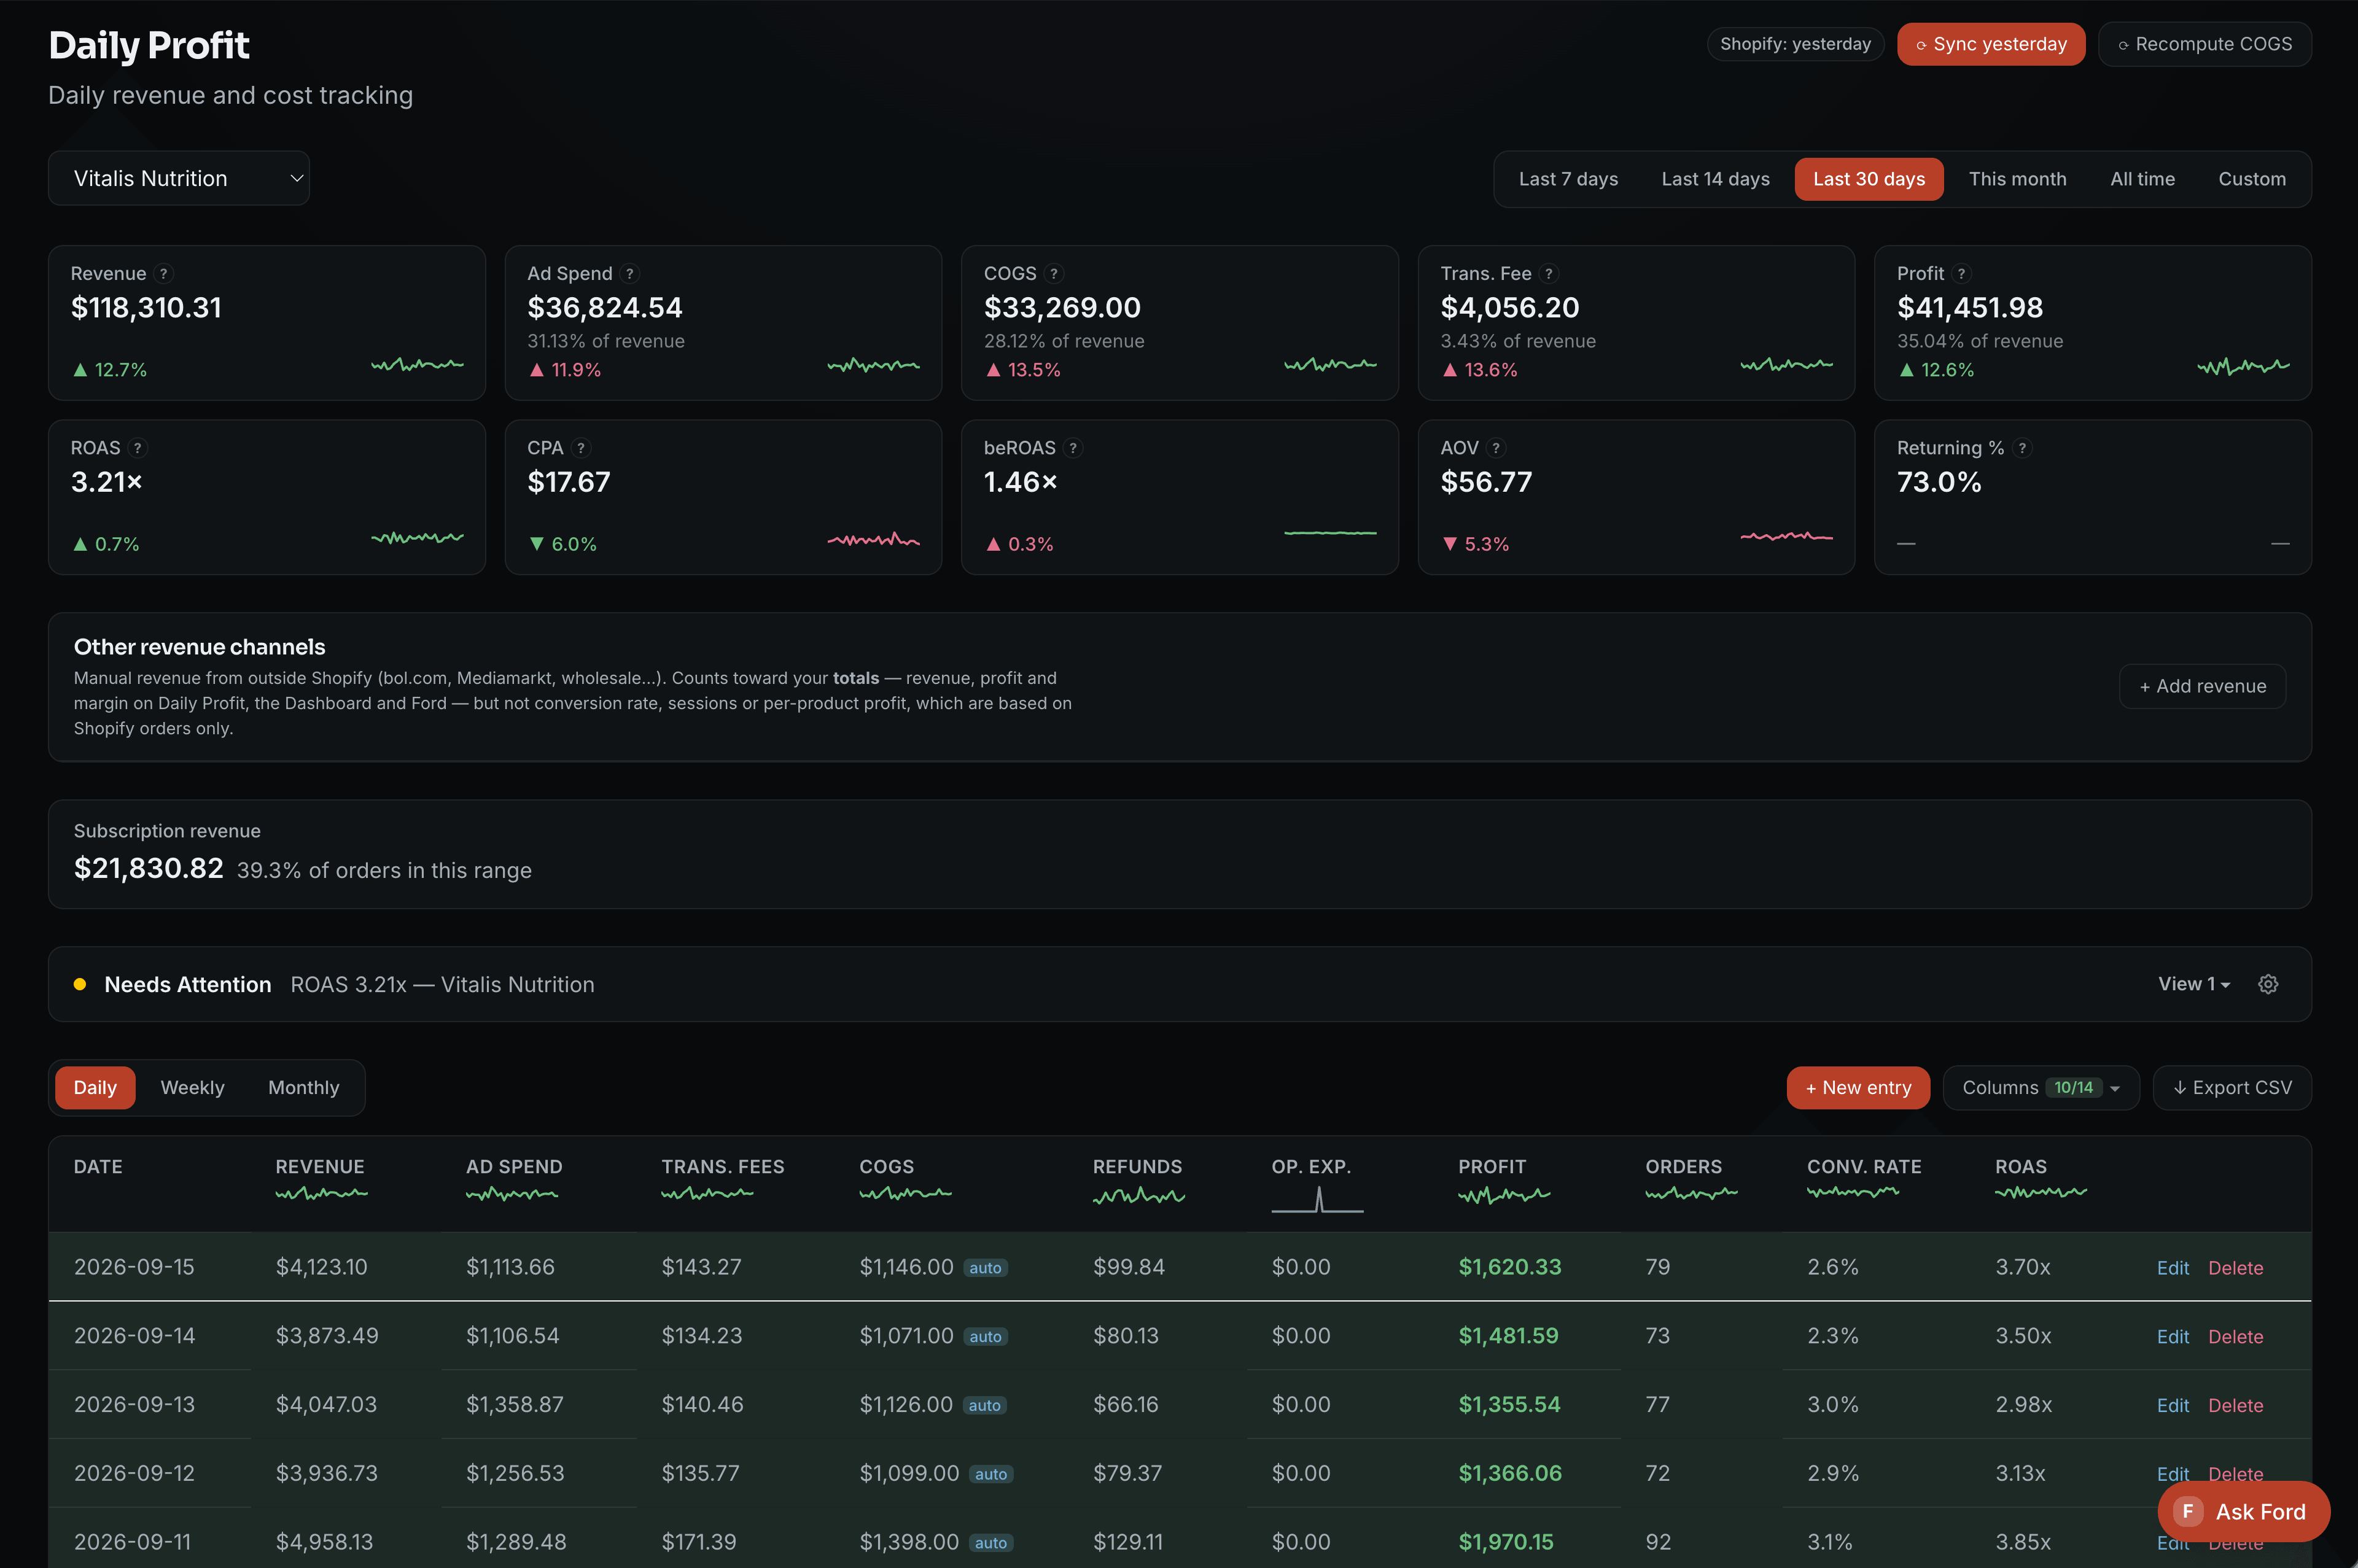
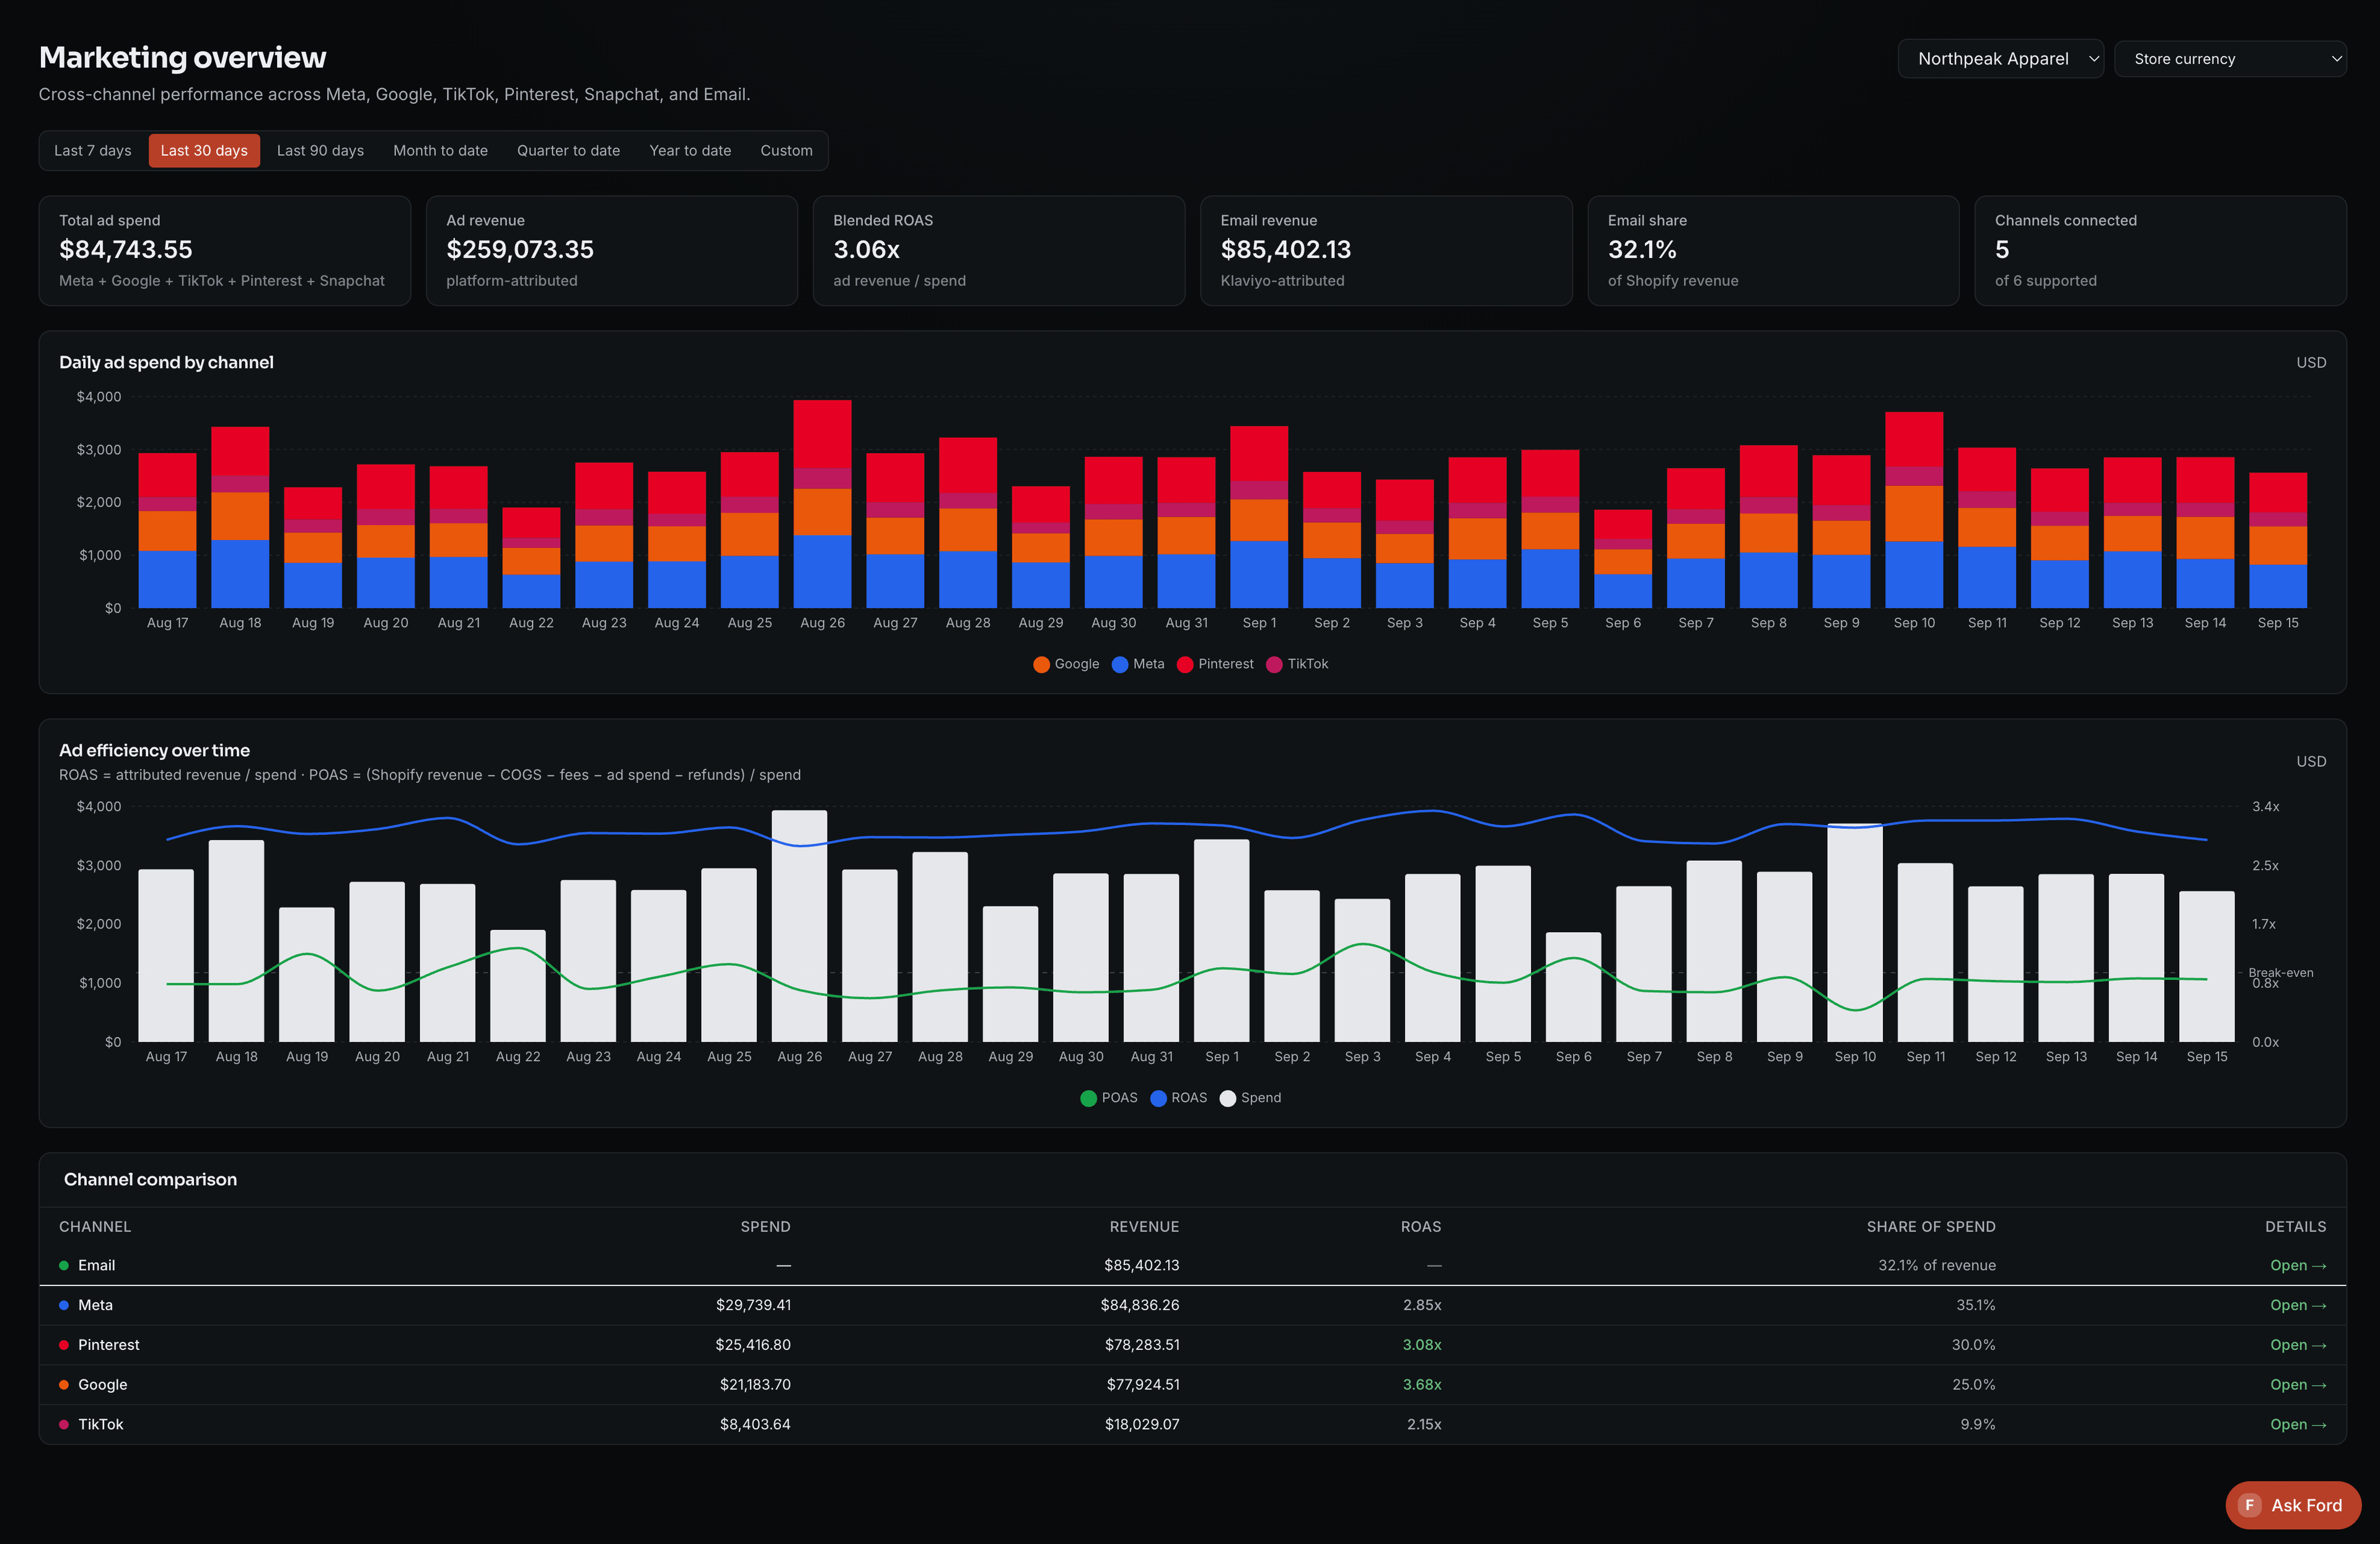
Business performance
Agreed sales, costs and profitability calculations, with the inputs and definitions behind them.
Marketing performance
Platform and campaign views using the connected sources and their attribution definitions.
Product detail, where supported
Product-level views when identifiers and source data can be mapped reliably.
A dashboard fitted to the decisions
Charts, daily views and breakdowns selected for the way your team reviews performance.
Know what is inside the number.
Revenue, contribution and net profit are not interchangeable. We agree the treatment of product costs, ad spend, fees, refunds and other included expenses before labeling a profitability view.
Platform-attributed revenue also needs its source and attribution window. Revenue claimed by more than one advertising platform is not automatically additional business revenue.
The report should show source freshness and missing inputs—not hide uncertainty behind a precise-looking total.
Start with the question the report needs to answer.
Define the decision and metric
Agree what the team needs to see and exactly how each important number is calculated.
Connect the named sources
Assess Shopify, the selected marketing accounts and the cost inputs required for those views.
Check representative records
Compare dates and totals with the source systems and test mappings, currencies, refunds and missing data.
Make the result usable
Deliver the agreed dashboard views with clear definitions and refresh expectations.
Your team provides account access, cost definitions, product mappings where needed, and a responsible owner for manually supplied costs. Historical imports and data cleanup are scoped explicitly.
- Agreed sources
Store sales, selected advertising accounts and the required cost inputs
- Definitions
Date range, currency, refund treatment, included costs and attribution sources
- Prepared view
Business, platform and campaign reporting, with product detail where mappings support it
- Human decision
Review the result with source freshness and missing inputs visible
Can we improve a dashboard we already have?
Potentially. We inspect its condition, definitions and integrations first, then decide what can be reused and what needs repair or replacement.
Can you show profit by product or platform?
Where the sources and mappings support the view. We define the included costs and attribution rather than claiming perfect causal accuracy from the dashboard alone.
Is everything real-time?
No universal refresh guarantee applies. Timing depends on the connected sources and the agreed implementation. Refresh expectations and missing-data behavior are part of the scope.
Is this accounting or an audited financial statement?
No. This is a scoped operating and marketing reporting system. The proposal defines the sources, calculations and limitations; it does not turn the dashboard into audited accounts.
A defined build. Support beyond delivery.
Your implementation is quoted around the workflows, integrations and stores involved. The build is paid 50% upfront and 50% at completed and accepted delivery.
Fourteen calendar days of stabilization are included. After that, a separately priced support and improvement service starts with an initial three-month commitment, paid monthly in advance. It then renews monthly, with 14 calendar days’ notice required before renewal to end service.
Vendor subscriptions and usage costs are separate where applicable. Your proposal sets out the build, monthly service, initial commitment and applicable taxes before you proceed.
See the delivery and service detailsWhich report do you keep rebuilding?
Tell us which numbers your team needs, where they come from and what decision they should support.